Figure 1.1
Chapter 1 · Every Device Is a Computer
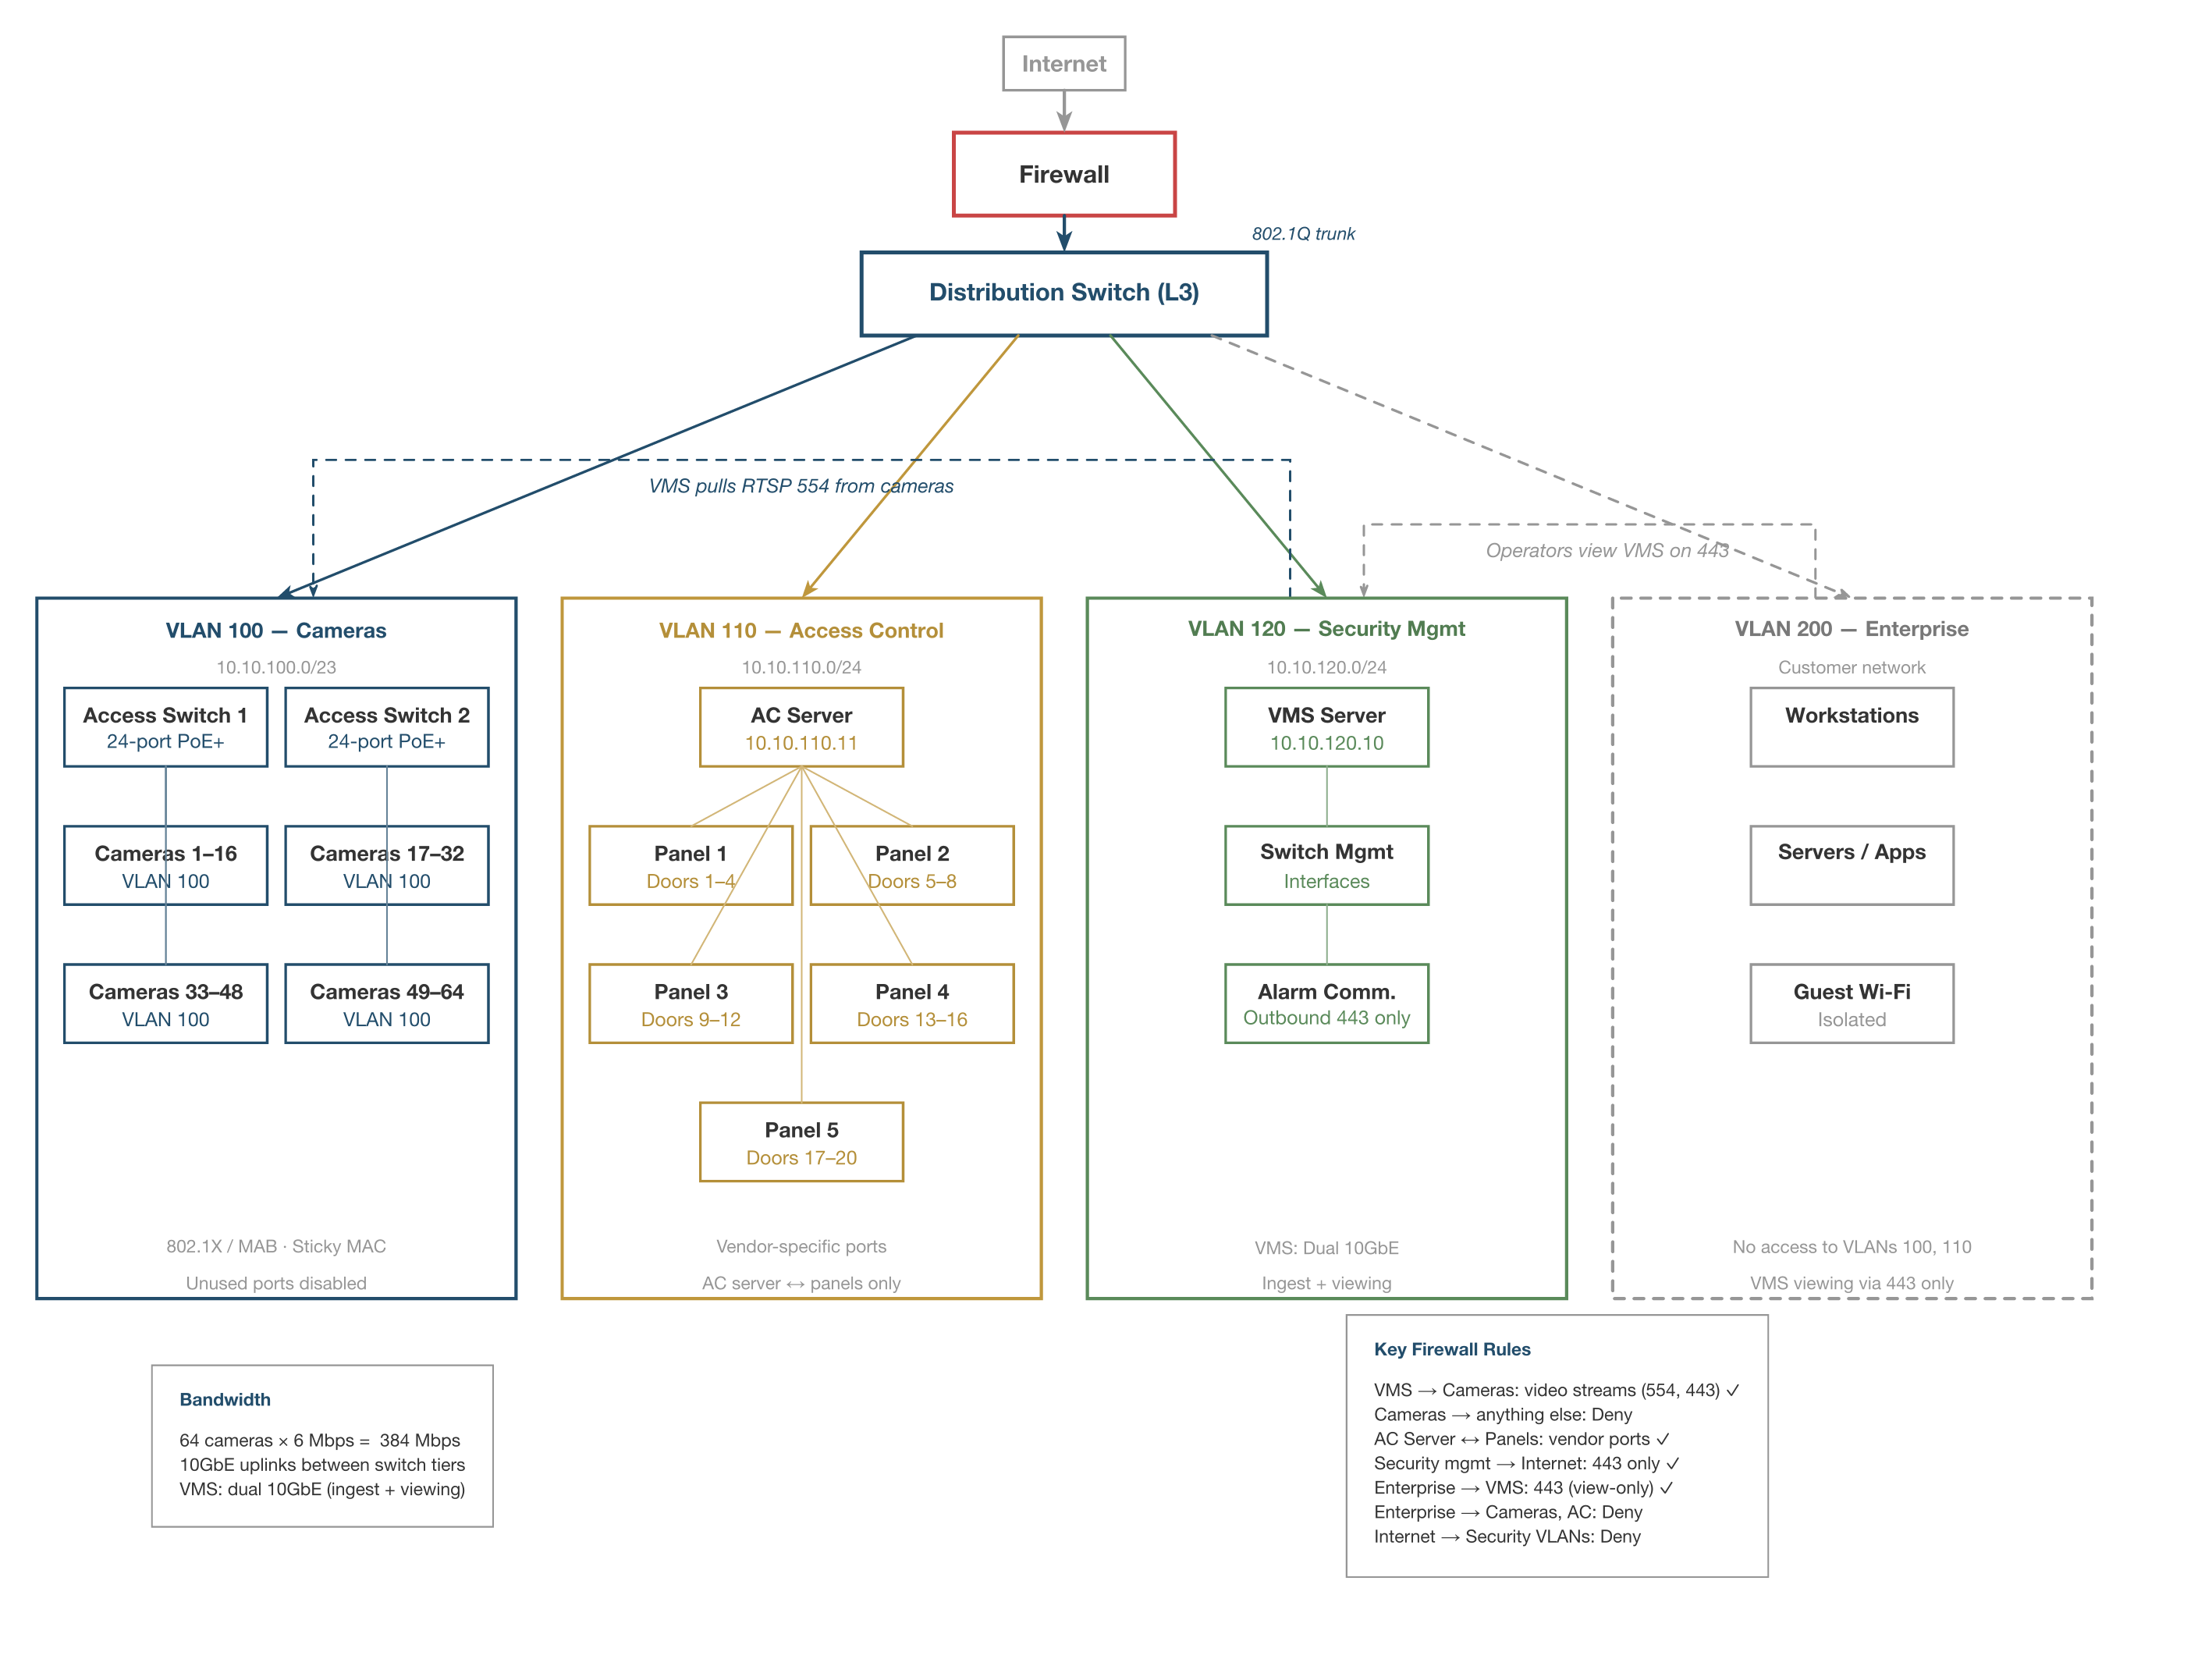
Flat Network vs. Segmented Network
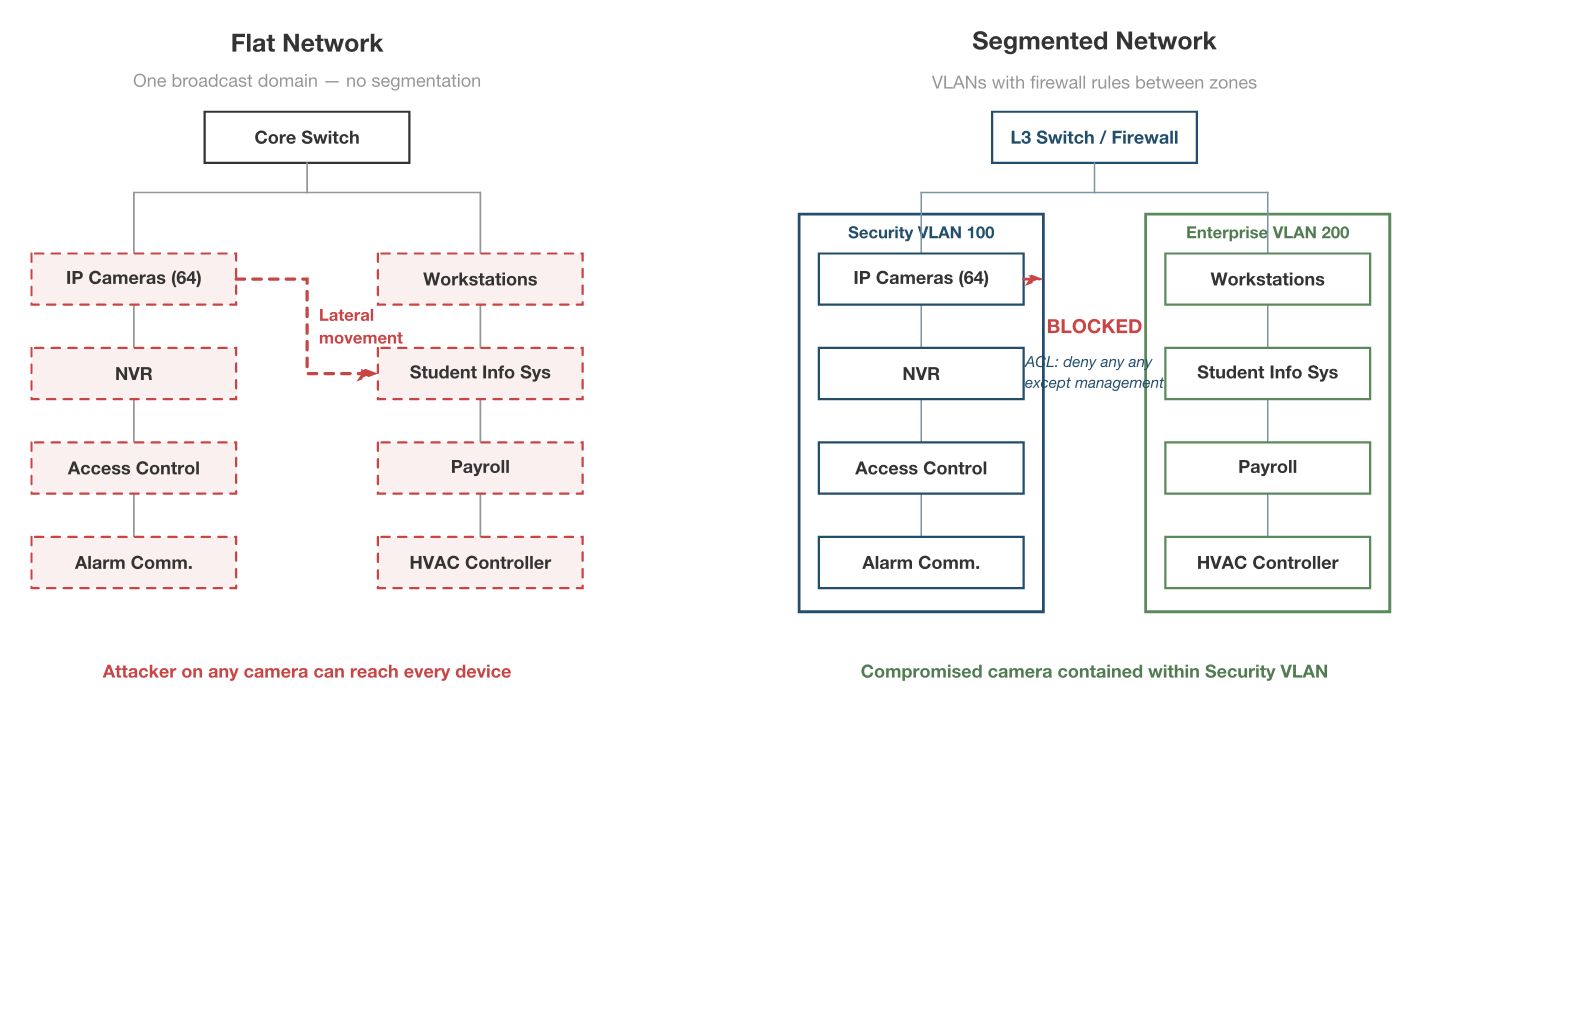
What It Shows
A side-by-side comparison: on the left, forty-eight cameras, an access control controller, and a district's student information system all sharing one subnet. On the right, the same devices placed on isolated VLANs with explicit firewall ACLs blocking lateral movement between zones.
Why It's Here
This is the foundational image of the book. Integrators need to see — in one glance — that "it works" (flat) and "it's safe" (segmented) are not the same thing. The figure anchors every later discussion of VLANs, ACLs, and trust boundaries.